

Dashboard
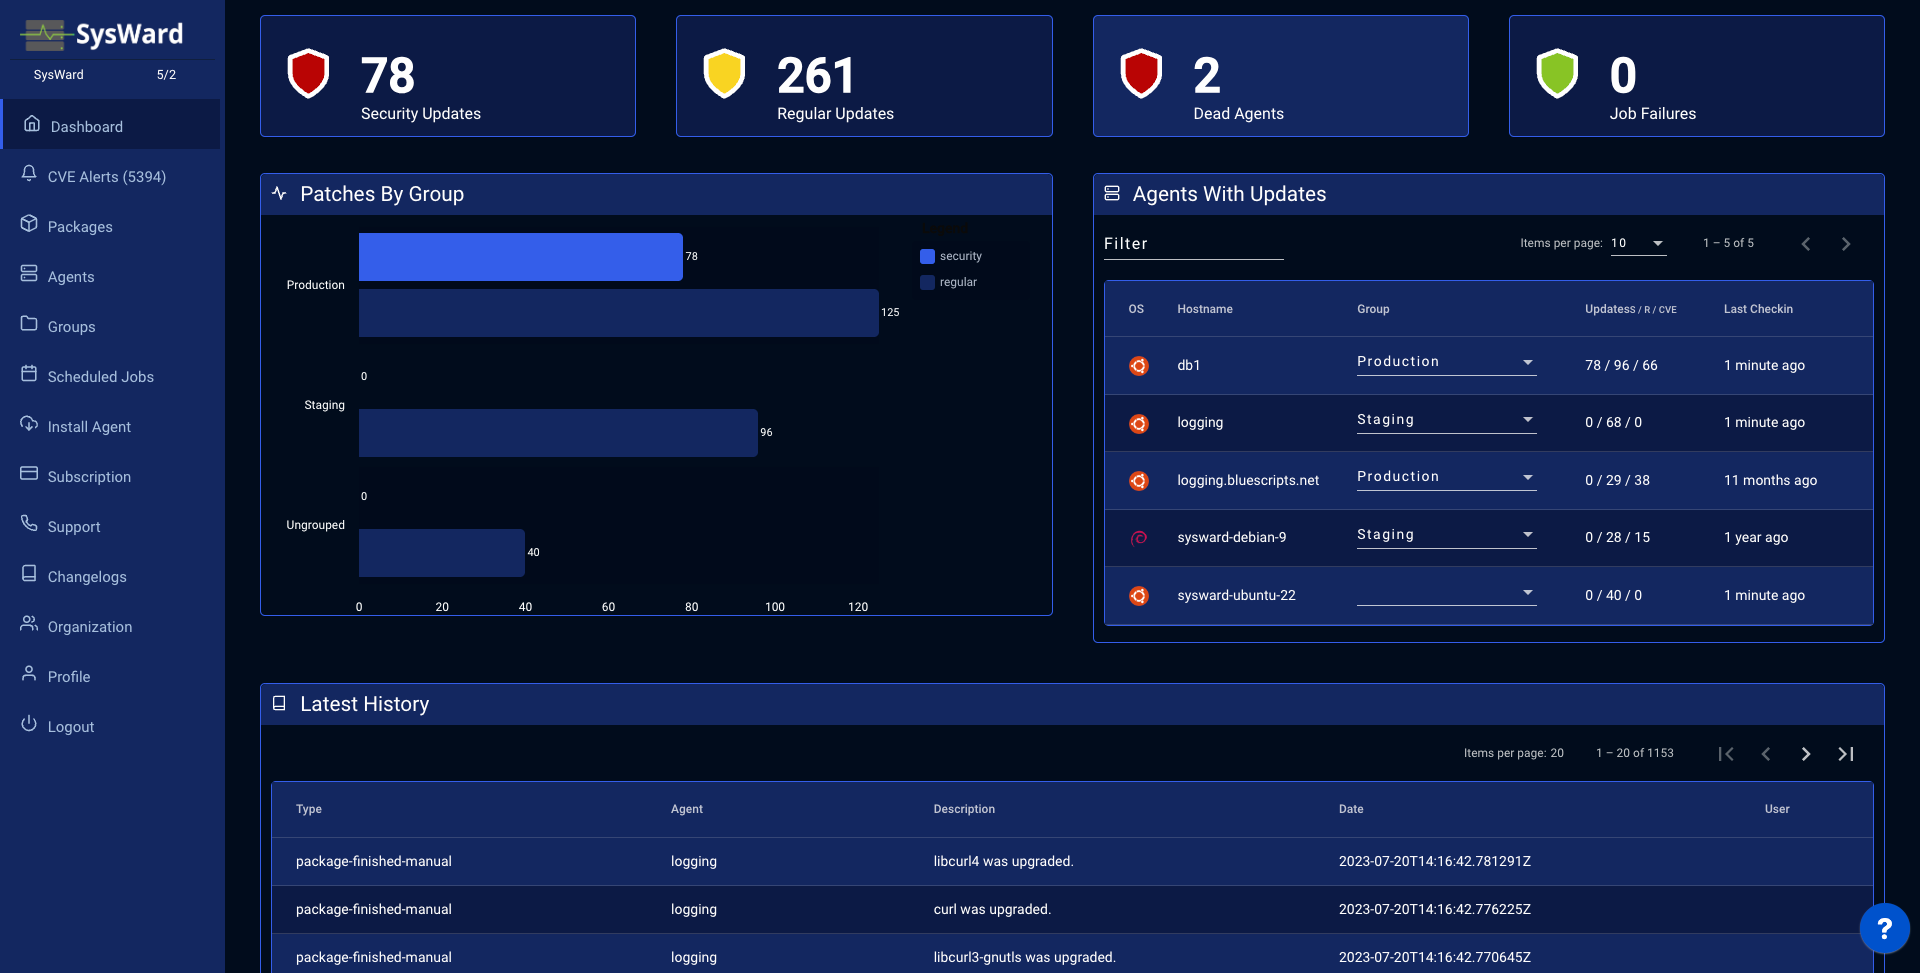
The dashboard gives you an at-a-glance view of your fleet’s patch and vulnerability status. It has three parts.
Summary cards
The cards across the top show the totals that matter most. Each one is also a shortcut — click the number to jump straight to the Agents list pre-filtered to those servers:
- Security Updates — servers with pending security patches
- Regular Updates — servers with pending non-security updates
- Dead Agents — agents that haven’t checked in within your organization’s dead-agent timeout (configurable on the Organization page)
- Job Failures — jobs that didn’t complete successfully
Patches By Group
This chart breaks pending security vs. regular updates down by group, so you can see which parts of your infrastructure are furthest behind at a glance.
Agents With Updates
A table of the servers that have work waiting, showing each agent’s OS, hostname, group, update counts (security / regular / CVE), and last check-in time. Use the filter box to narrow the list, or reassign a server’s group inline from the dropdown.
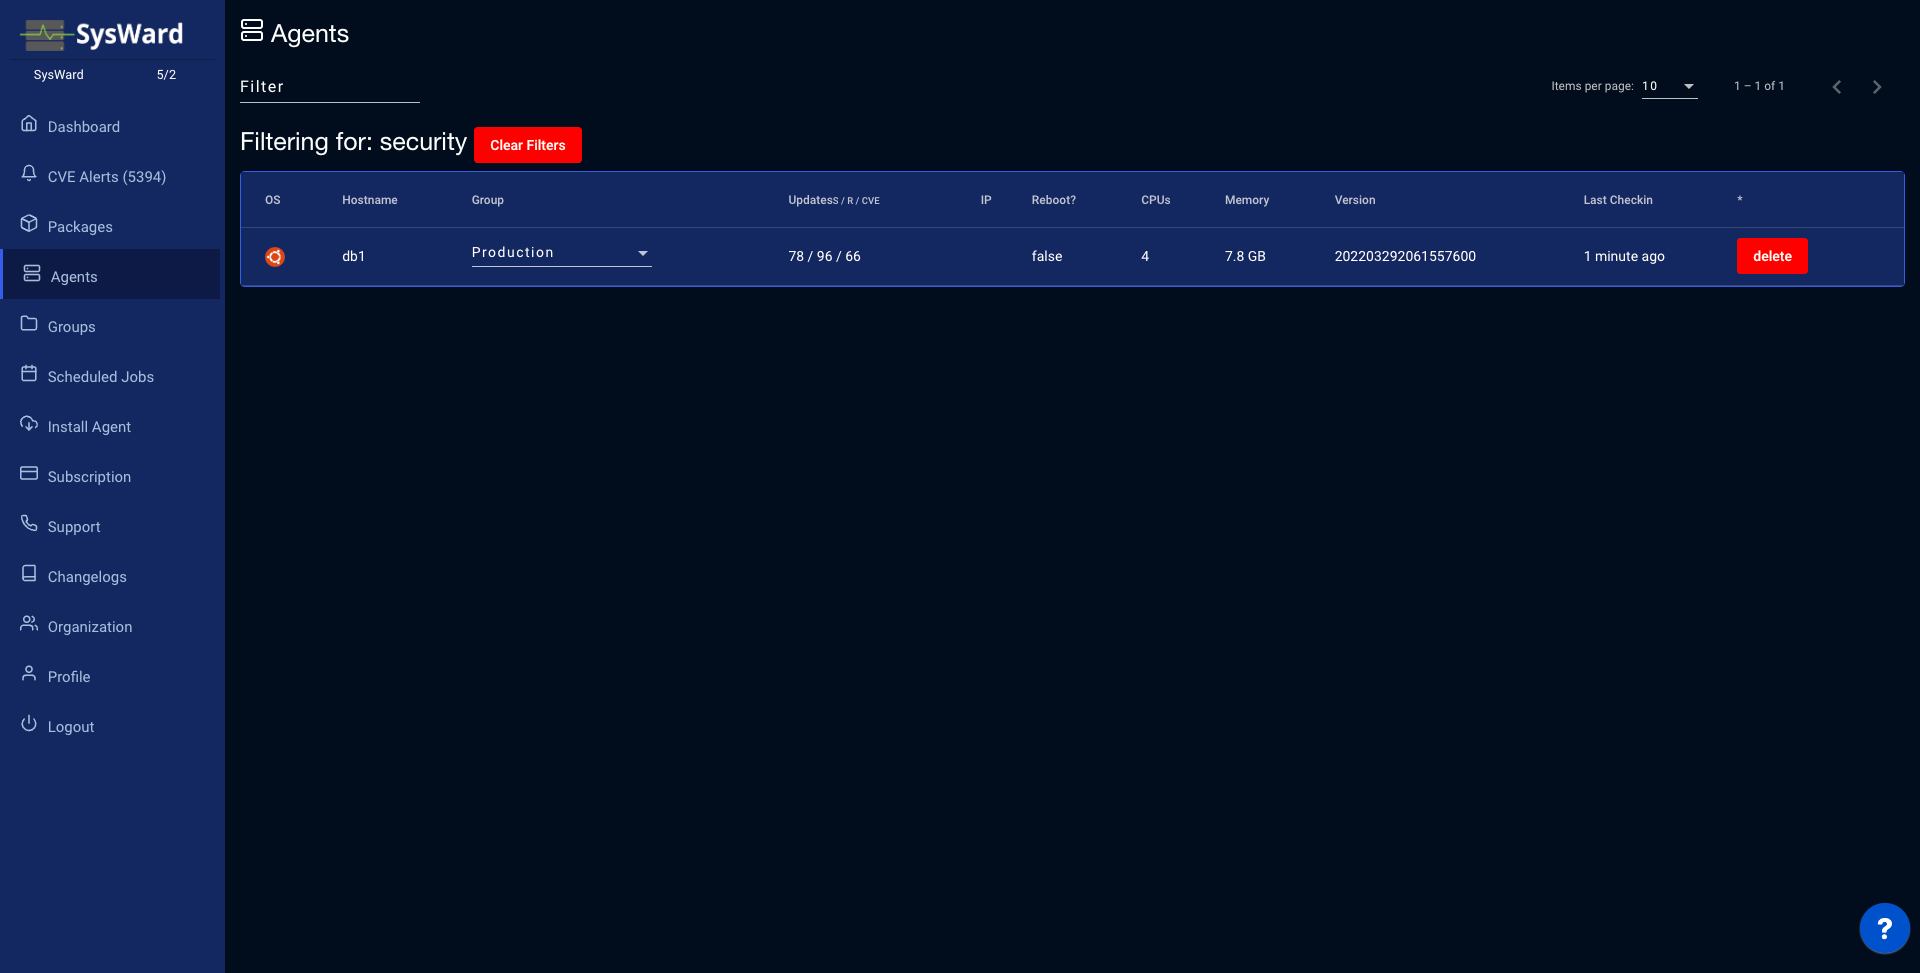
Clicking any summary-card number (Security, Regular, Dead, or Job Failures) opens the Agents list with that filter already applied.