Dashboard
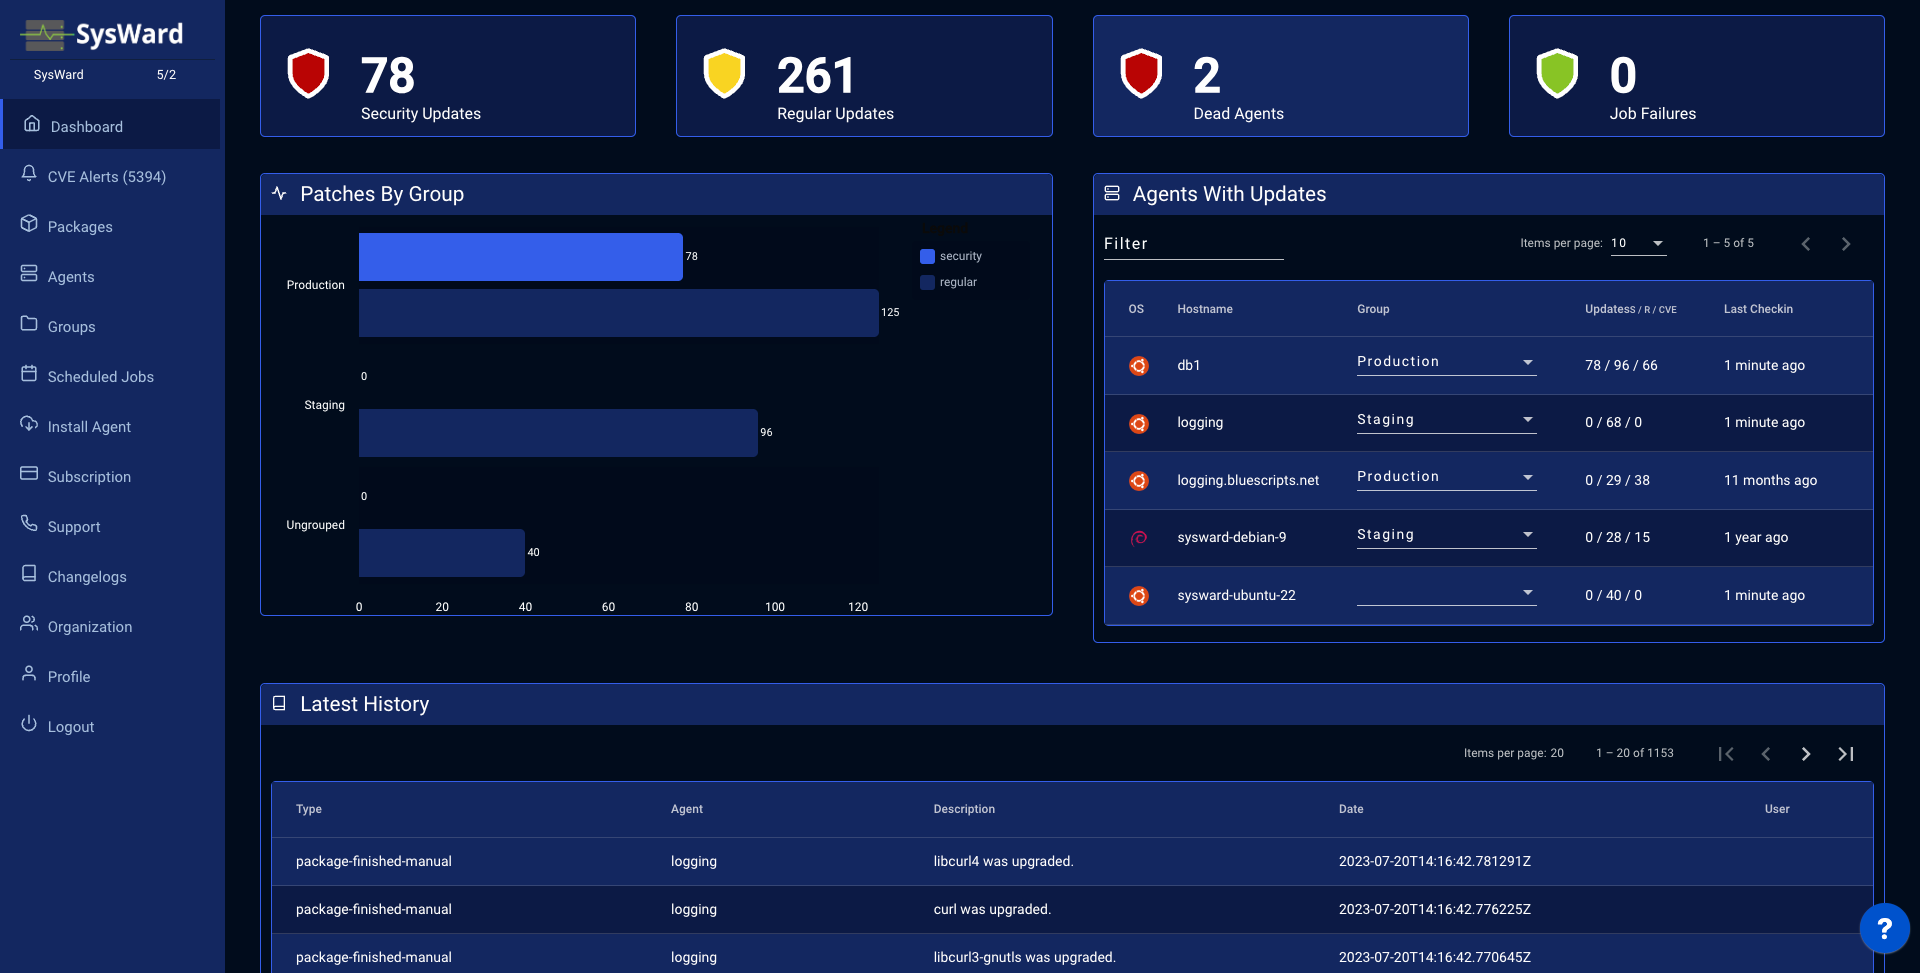
Using the dashboard you can get a quick overview of the current state of your infrastructure. The dashboard is divided into several sections:
- Updates pending.
- Groups with security and regular updates.
- Quick View of agents with updates.
- Latest job executions and their status.
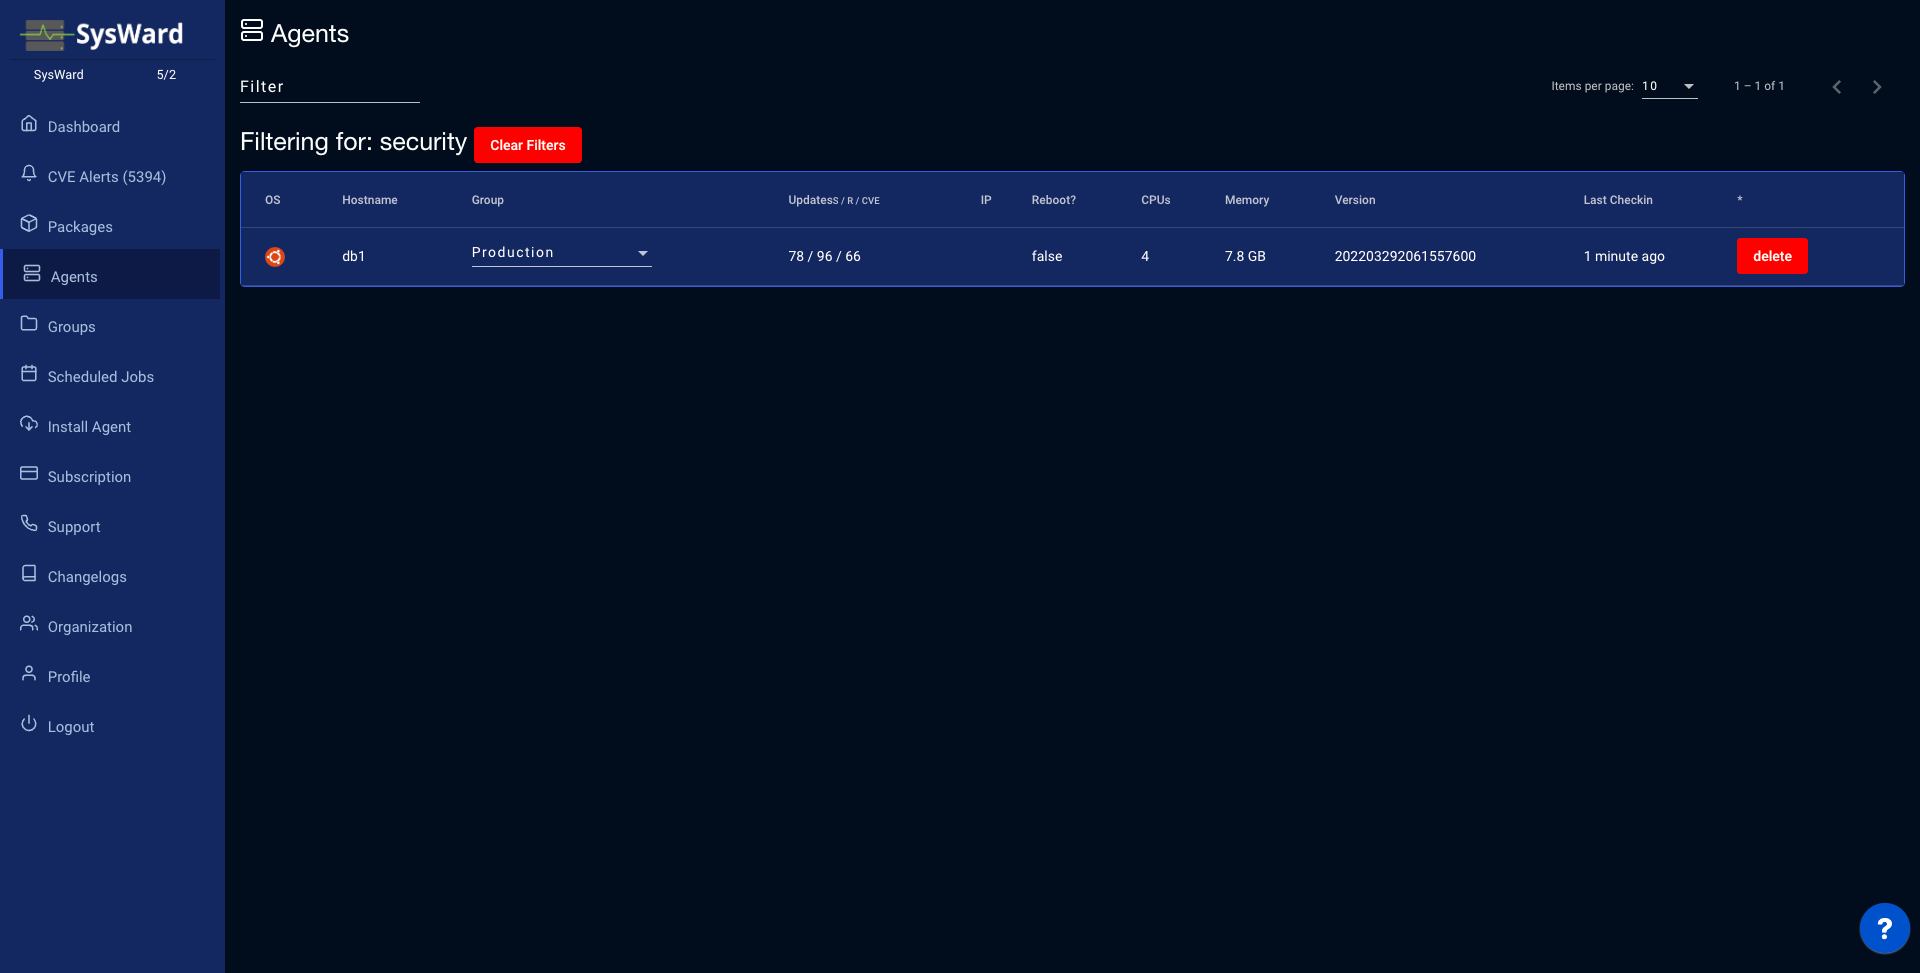
You can quick filter to any of the large boxes up at the top (Security, Regular, Dead, Job Failures) by clicking on the number. This will bring you to the agents list with the filter applied.